Which generation “wins” when it comes to car loan refinancing? We turned to the data to find out.
Spend any time on the internet, and you’ll get the impression that there’s a bit of a generational face-off going on. Baby Boomers tease Millennials about the “participation trophies” they received as kids. Gen Z coined the dismissive “Okay, Boomer” to underscore how out of touch the older generation is.
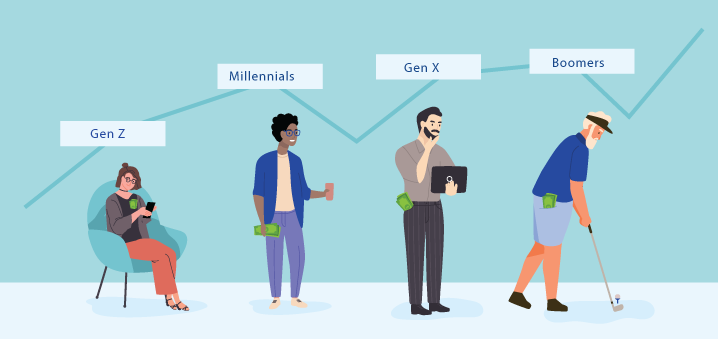
While strife among the generations is often played up for clicks, the financial lives of Boomers (born 1946-1964), Gen Xers (born 1965-1981), Millennials (born 1982-1996), and Gen Zers (born 1997-2010) have been shaped differently in some very real ways.
For example, Boomers entered their prime earning years in the 1980s and ‘90s, a period defined by steady economic growth. Meanwhile, many Millennials entered the workforce in the midst of the worst economic downtown in almost a century.
Generational differences are evident, too, when it comes to car loans, specifically, how much car owners of different generations are able to save by refinancing.
We examined RateGenius customer data from 2012 to 2019 and broke it out by generation:
- Gen X saves the most, but Gen Z gets a bigger financial boost. Gen X saved the most money per month, but Gen Z saved more as a percentage of their monthly income and saw the steepest decline in the interest rate on their remaining loan.
- Refinancing saves at least $900/year across generations. Gen Z, Millennial, Gen X, and Boomer car owners who refinanced their car loan all saved at least $900 per year on their loan.
- Credit scores don’t determine savings. Baby Boomers saved the least by refinancing their loans despite having higher credit scores than Generation X, Millennials, and Generation Z.
Table of Contents
Let’s get started.
The Borrower: Gen Xers Earn the Most; Boomers Owe the Most
Decades into both their earning and borrowing lives, Baby Boomers and Gen Xers have had more time than the younger Millennial or Gen Z generations to build both income and credit. But they’ve also had more time and more opportunities to incur debt. Lenders consider all financial information when deciding whether or not to refinance a loan.
Income: Gen Xers Hit Peak Earnings as Boomers Ease Into Retirement
Generation X is at the peak of their earning potential, bringing in an average of just under $6,100 per month. Baby Boomers’ average income is lower at $5,437 per month. This is likely because Boomers are heading into retirement and/or taking on lower-earning or part-time jobs.
Gen Z refinancers are the lowest on the income bracket: The oldest, at 24, have been in the workforce for only a couple of years at most.
Debt: Millennials Aren’t the Most in-Debt Generation
Popular imagination paints Millennials as debt-burdened by student loans. But Generation X and Baby Boomers have higher debt loads than Millennials due to mortgage payments, credit card debt, and, in the case of Generation X in particular, student loans. In fact, Generation X and Baby Boomers both carry more student loan debt than Millennials, according to data from Experian.
You may be thinking that people with less debt are better candidates for
car loan refinancing. You’d be wrong.
RateGenius data shows that across all four generations, car owners approved for refinancing have higher debt burdens than the overall dataset.
It turns out that the total amount of debt matters less than how reliably a borrower pays off that debt. That’s where credit scores come in: Higher scores signal that borrowers are more reliable at paying off their debt which makes them better “bets” for lenders and better candidates for refinancing.
Debt-To-Income: Boomers’ Income Is Decreasing — but Their Debt Is Not
While income and debt levels are important to consider when refinancing, what matters more is a borrower’s ratio between those two numbers: the debt-to-income ratio, or DTI.
DTI is one factor used to determine whether to extend someone a loan or refinance an existing loan. The higher your DTI, the higher the risk for the lender. The greater the perceived risk, the more difficult it is to secure a loan — or get favorable loan terms if you are approved.
RateGenius data shows that 90% of approved auto refinance loan applicants from 2015 to 2019 had a DTI of less than 48%. Borrowers across all four generations are comfortably within that window.
From 2015 to 2019, 90% of approved auto refinance loan applicants had a DTI of less than 48%.RateGenius
Further Reading: Debt-to-Income Ratio Explained: How DTI Affects Car Finance Loans and More
Generation X may have the most debt, but both Millennials and Baby Boomers have a higher debt-to-income ratio (DTI) — 32% — compared with Gen X’s 31%. Why? While Boomers’ monthly debt burden is only slightly lower than Gen X’s, at $1,482 versus $1,514, their income is significantly lower, at $5,437 compared with $6,092.
At 32%, Millennials’ DTI is also higher than Generation X’s for the same reason. In their late twenties and thirties, Millennials are still climbing toward their peak earning years. Generation Z borrowers, by contrast, have the lowest debt-to-income ratio of all four generations at just under 29% — likely because Gen Z hasn’t started to assume debt from mortgages or student loans.
Credit Score & Credit History: Time Is on the Baby Boomers’ Side
DTI isn’t the only important factor that lenders consider. The higher a borrower’s credit score — and the longer their credit history — the more likely the borrower can and will pay the loan back.
Boomers who’ve successfully refinanced have the best credit score at 715. As the oldest cohort, they also have the longest credit history, at 257 months. Gen Z applicants have both the lowest credit score (705) and the shortest credit history, which makes sense — with an average credit history of just 40 months, Generation Z hasn’t had as long of a timeline as other generations to build credit.
Despite having a longer credit history, Generation X’s credit score is slightly lower than Millennials’ who’ve refinanced, at 698 versus 701. One explanation could be that Generation X carries a higher credit card balance than Millennials — $8,023 versus $4,712 as of Q1 2019, according to data from Experian.
It’s not surprising that those who refinanced had higher credit scores than the overall dataset which also includes people whose refinancing applications were denied. What is interesting is that the gap between those two numbers closes with age.
🏆 The Winner: Generation X
A low debt-to-income ratio makes up for Gen X’s slightly lower credit score. Approved Gen Z refinancers had credit scores 78 points higher than Gen Z applicants who were not approved. At the other end of the age spectrum, approved Boomers’ scores were just 59 points higher than Boomers that were not approved.
The key factor here is likely credit length — the longer a borrower’s credit history, the more likely the score indicates their trustworthiness. Gen Z’s credit scores may look good now, but will they stay good? With only 40 months of credit history to go off of, lenders may wonder.
The Car: Baby Boomer Cars Have High Value and Low Mileage
A borrower’s financial standing isn’t the only factor that lenders take into account when deciding whether to refinance their loan — the state of the car itself is also an important consideration. In the event that something goes wrong and the borrower is no longer able to repay their loan, lenders want to know that they will be able to recoup their investment in the form of the car itself.
Retail and Trade Value: Gen X Cars Have the Most Value
Gen X’s cars have the highest retail and trade value at $23,501 and $20,632, respectively. Boomers aren’t far behind, at $22,818 retail and $19,979 trade. Boomers are also the most likely generation to have bought their car new, with 38% of applicants reporting that they did so.
Mileage: More Miles Means Lower Retail Value for Gen Z
A number of factors impact a car’s value, from age and accidents to the make, model, and year of the vehicle. Mileage, too, is a consideration. More mileage means more wear-and-tear — and less money to be made from reselling the car in the event of repossession.
At 48,754 miles, Generation Z’s cars had the highest at the time of refinancing. They’re also the generation least likely to have bought their car new, with just 23.6% of Gen Z reporting having done so.
Millennials are more likely to have bought their car new than Gen Zers, with 31% of approved borrowers refinancing a new car. Also driving up the mileage for Millennials is commuting: Now that the youngest Millennials are in their mid-twenties, they’re driving an average of 53.2 minutes round-trip to work.
There’s a more significant dropoff in the Boomer generation — their cars have only 40,330 miles on average. Sure, their cars may be newer, but they’re also being driven less. People in this age group are heading into retirement and no longer commuting to work.
LTV: Gen Z Refinancers Are Upside-Down on Their Loans — but Only Barely
Just as debt and income become meaningful metrics for refinancing when combined as the debt-to-income ratio, a car’s retail value assumes significance when compared to loan debt.
This metric, called the loan-to-value ratio or LTV, tells potential refinancing partners how much you owe on your vehicle relative to how much it’s worth. If your LTV is too high, lenders may not be comfortable refinancing your loan.
Boomers, Generation X, and Millennials approved for refinancing all had LTVs below 100% — 96.4% for Boomers, 97.3% for Gen X, and 97.9% for Millennials. This means that car owners in these cohorts owe less on their loans than their car is worth. If something were to happen and the borrower stopped making payments on the loan, the lender could theoretically repossess the car and still recoup the value investment.
Further Reading: Your Loan-To-Value Ratio and Car Loan Refinancing
Generation Z is the one generation where borrowers were approved for refinancing with LTVs over 100%, but they only missed the cutoff by a slight margin, at 100.7%. The sooner Gen Z borrowers can bring that ratio under 100, the better. It means they’ll avoid having negative equity or being upside down on their car loan.
Car (LTV) Loan-to-Value Calculator
A loan-to-value ratio over 100% means you owe more on your loan than your vehicle is worth. An LTV over 125% can make it harder, but not impossible, to qualify for a refinance loan.
If your LTV is less than 100%, your car's value is higher than what you owe on your loan. The lower your LTV, the better.
🏆 The Winner: Boomers
Thanks to high retail value, low mileage, and low loan-to-value ratio, Baby Boomers approved for refinancing have cars that are in the best shape.
The Loan: Gen X Borrowed the Most, but Gen Z Pays in Interest
We know the financial situations of each generation and the state of the cars they wish to refinance. Now, let’s look at the original terms that they were offered when they first took out their loan.
Because in order to appreciate the benefits of a lower monthly payment, lower interest, and a lower payment term, you must know where you started.
Loan Amount: Gen X Has the Largest Loan and the Highest Monthly Payment
Loan amounts across generations are very similar. Generation X took out the largest loan amount for their vehicle — an average of $26,712 across all who applied for auto loan refinancing. Coming in second are Baby Boomers at $26,179. Millennials are third, having taken out an average of $25,225.
Gen Z applicants also took out smaller auto loans than the other generations, an average of $21,279. They also had more loan left to pay at the time of refinancing than everyone else except Baby Boomers.
It’s worth noting that car prices have been increasing steadily over the past few years. Higher car costs, and higher car loans, translate to higher monthly payments.
According to Kelley Blue Book, the average price for a newly bought light vehicle reached $38,635 in August 2020 — up 3.9% from the same time the previous year. That’s a faster growth rate than real average hourly earnings, which increased 3.3% from September 2019 to September 2020, according to the U.S. Bureau of Labor Statistics.
All four generations were paying at least $400 per month on car payments, with Gen X paying north of $500. Sure, monthly payments may be within a few dozen dollars per month, but those car payments potentially have a very different impact on each generation’s overall financial picture.
For Millennials and Boomers, car loans take up just under 10% of their income. For Gen X, the number is still lower at 8.1% — well within financial experts’ advice to limit car costs to 10% of your income. For Gen Z, a $416 per month car payment takes up 13.3% of their monthly income.
| Generation |
Average Monthly Car Loan Payment* |
Car Loan as Percent of Income |
| Gen Z |
$416 |
13.3% |
| Millennials |
$479 |
9.3% |
| Gen X |
$504 |
8.1% |
| Boomers |
$472 |
9.6% |
*Before refinancing car loan with RateGenius
With costs like cars, health insurance, and rent increasing faster than income, borrowers are increasingly hoping to refinance their loan obligations. The more you can save on things like car loan interest, the more money you have available to redirect toward other rising costs.
Interest Rate: High Interest Rates Give Gen Z a Lot To Lose
Prior to refinancing, Millennials, Gen X, and Boomers all had very similar loan terms — the time span they have to repay the loan. But that shorter payback term doesn’t get Gen Z very far, particularly when you factor in the next piece of the loan puzzle: the interest rate.
Of all the reasons why it’s worth seeking to refinance, high interest rates (multiplied across a span of five or more years) can mean borrowers spend thousands of dollars more for their car than it was worth at purchase.
Granted, collecting interest on a loan is how lenders make a profit and are able to extend loans in the first place. But the interest rates borrowers are offered at the outset of their loan aren’t necessarily the best loan terms available — which is where refinancing comes in.
Gen Z borrowers had the highest interest rate by far prior to refinancing, at 12.5%. This makes sense given their short credit history. Without as many data points proving that they are reliable and will pay the loan, these borrowers are risky to lenders.
Millennials and Gen Xers had very similar interest rates prior to refinancing — 10.3% for Millennials and 10.0% for Gen X.
Boomers had the lowest interest rate, another product of their good credit and long history, which signals to lenders that they are “good for” the remaining balance.
🏆 The Winner: Millennials
With car loan payments making up just under 10% of their income and monthly payments well below $500, millennials are keeping affordability in mind when taking out a car loan — even though interest rates aren’t as competitive as their Baby Boomer parents’ rates.
The Refinance: Who Saves the Most From Refinancing?
Now that we’ve looked at the generations’ financial history, their cars, and their previous car loans, it’s time to look at what happens when we take all of those inputs and come out on the other side with an offer to refinance.
What we see is a sharp decrease in the interest rate, term length, and monthly payment across the board. However, the decreases mean something slightly different for each generation, based on their previous terms and their overall financial picture.
Interest Rate: Gen Z Gets the Biggest Break on Interest
Generation Z saw the steepest drop in their interest rate, going from 12.5% before financing to 5.2% after. Millennials and Gen X each cut their interest rate by roughly half, dropping from 10.3% to 5.3% and 9.9% to 5.2%, respectively. Boomers’ interest rate decreased the least, dropping from 8.9% to a little over 4.7%.
| Generation |
Original Interest Rate |
New Interest Rate |
Difference |
| Gen Z |
12.5% |
5.2% |
7.3% |
| Millennials |
10.3% |
5.3% |
5.0% |
| Gen X |
10.0% |
5.3% |
4.7% |
| Boomers |
8.9% |
4.7% |
4.2% |
Monthly Payment: Gen X Saves the Most; Boomers Save the Least
Generation X saw the biggest overall decrease in their monthly payments after refinancing, dropping $86 to $420 per month, followed by Milllennials with $85. Boomers and Gen Z saw the smallest savings, $77 a month.
Gen Z saved the most as a percentage, decreasing their monthly payment by 18%, compared with 17% for Millennials and Gen X, and just 16% for Boomers. And with an average monthly income of only $3,114 per month, that $77 saved per month means more for Gen Z’s overall financial picture than the $83 saved by Gen Xers earning more than twice as much.
| Generation |
Original Monthly Payment (Avg.) |
New Monthly Payment (Avg.) |
Monthly Savings (Avg.) |
% Saved |
| Gen Z |
$416 |
$340 |
$77 |
18% |
| Millennials |
$479 |
$396 |
$85 |
17% |
| Gen X |
$504 |
$420 |
$86 |
17% |
| Boomers |
$472 |
$398 |
$77 |
16% |
The Savings: Generation X Saves the Most — but Generation Z Gains the Most From Saving
Overall, Generation X has saved the most by refinancing their car loan, saving around $86 per month or $1,001 per year on their loan.
Coming in a close second place are Millennials, who saved $85 per month or $994 per year. Not too far behind Millennials in third place are Generation Z, saving a little under $77 per month or $904 per year. And finally, there are the Baby Boomers, who saved $77 per month and $878 per year.
🏆 The Winner: Gen Z
While Gen X saw the biggest drop in raw monthly payment, we’re declaring this a victory for Generation Z. The 7-point swing in interest rate combined with the reduced term and their lower earning power mean that the savings Generation Z gains by refinancing have the biggest impact on their overall financial picture.
Conclusion: The Real Winners Are the People Who Refinance
While it’s all in good fun to pit Millennials, Boomers, Gen X, and Gen Z against each other in a mock battle of the finances, the truth is that all of the borrowers we’ve looked at are winners. Each of the approved applicants represented in this data took the step to find out whether there were better options for them to repay their loan, and each came away with a lower monthly payment, lower interest, and shorter loan term as a result.
When you multiply these savings across the remaining term of the borrower’s loan, you can see the compounding results of loan refinancing. That $80-90 per month saved on car loans translates into thousands of dollars that borrowers can redirect toward paying down other debt like student loans or credit cards or toward other financial goals like building an emergency fund or saving for a down payment.
They say that age is just a number, but when you consider what it can mean for your overall financial health, refinancing your car loan is anything but.
Methodology
RateGenius analyzed customer data from 2012 to 2020. This data set included roughly 3.8 million completed auto loan refinance applications. We examined average credit scores and annual savings by generation for all customers during this time period.
About The Author
RateGenius
A better way to refinance your auto loan. RateGenius works with 150+ lenders nationwide to help you save money on your car payments. Since 1999, we've helped customers find the most competitive interest rate to refinance their loans on cars, trucks, and SUVs. www.rategenius.com
;)